Grafana Dashboard
Pre-built Grafana dashboard for monitoring Oracle Cloud node health and recovery
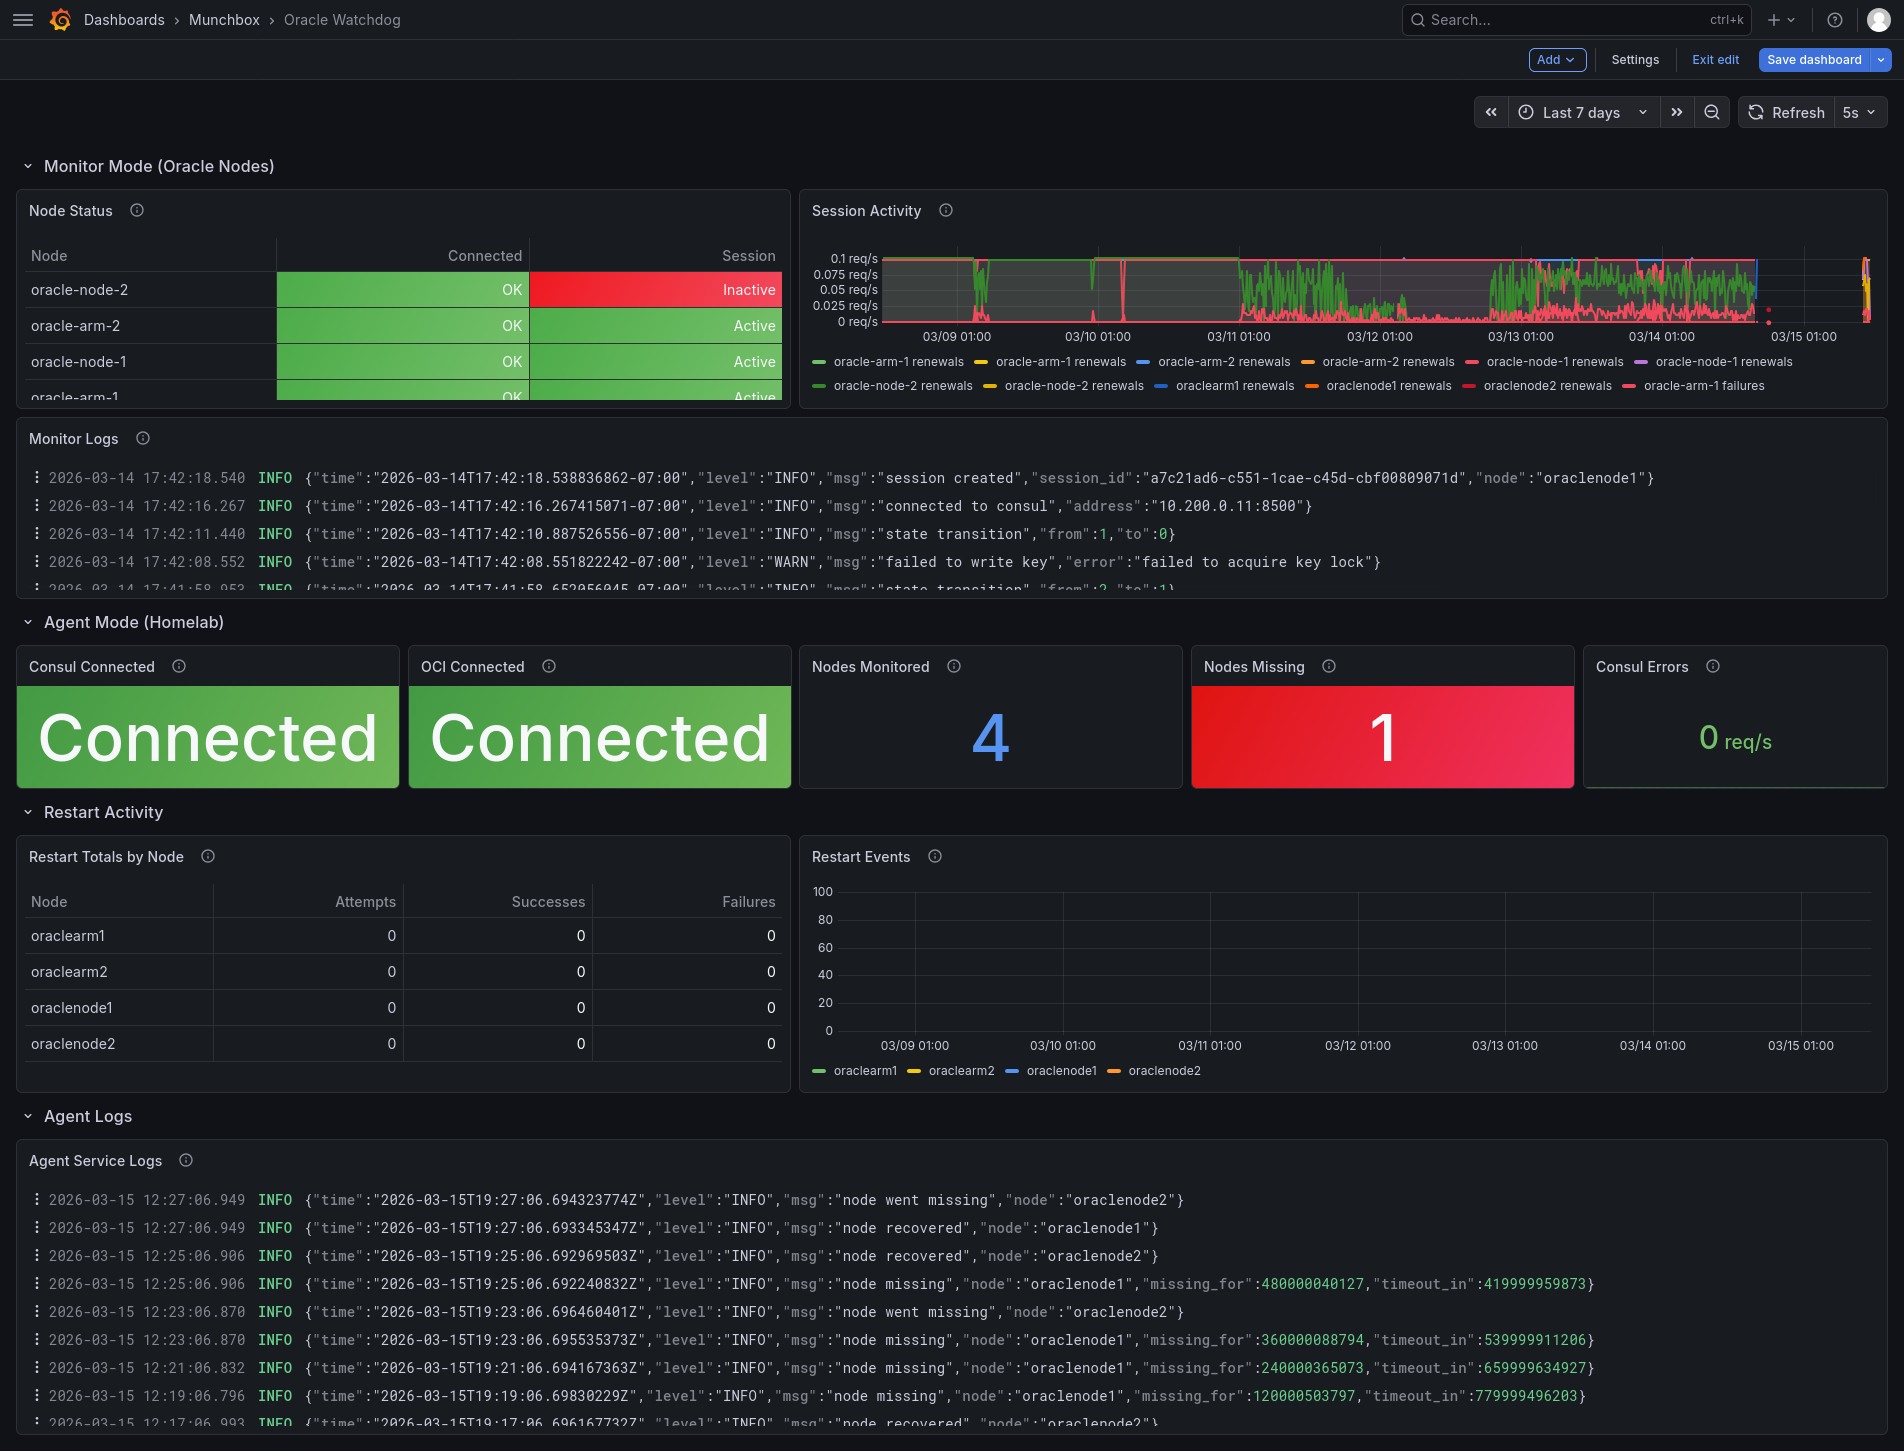
The dashboard is organized into three sections. Monitor Mode shows a per-node status table with Consul connection and session heartbeat health for each Oracle node, alongside a session activity timeseries and monitor logs from Loki. Agent Mode displays the agent’s Consul and OCI connection status, how many nodes are being watched, and whether any are currently missing. Restart Activity tracks cumulative restart attempts, successes, and failures per node in a table, with a timeseries view of restart events over time. Agent logs round out the bottom of the dashboard.
Metrics
Monitor Mode (:9104)
| Metric | Type | Description |
|---|---|---|
oracle_watchdog_consul_connected | gauge | Consul connection status (1=connected, 0=disconnected) |
oracle_watchdog_session_active | gauge | Session status (1=active, 0=inactive) |
oracle_watchdog_reconnect_attempts_total | counter | Consul reconnection attempts |
oracle_watchdog_session_renewals_total | counter | Successful session renewals |
oracle_watchdog_session_failures_total | counter | Session creation or renewal failures |
Agent Mode (:9105)
| Metric | Type | Labels | Description |
|---|---|---|---|
oracle_watchdog_agent_consul_connected | gauge | Consul connection status | |
oracle_watchdog_agent_oci_connected | gauge | OCI connection status | |
oracle_watchdog_agent_nodes_monitored | gauge | Number of configured nodes | |
oracle_watchdog_agent_nodes_missing | gauge | Currently missing nodes | |
oracle_watchdog_agent_restart_attempts_total | counter | node | Restart attempts per node |
oracle_watchdog_agent_restart_successes_total | counter | node | Successful restarts per node |
oracle_watchdog_agent_restart_failures_total | counter | node | Failed restarts per node |
oracle_watchdog_agent_consul_check_failures_total | counter | Consul KV check failures |